In the Summer 2018 IN$IGHT, “Debt Markets Remain Favorable to Borrowers – For Now”, we discussed non-commercial bank sources of capital and, more specifically, Business Development Companies (BDCs). The purpose of focusing our attention on this relatively small capital market is that it represents the source offering the highest leverage to private company acquirers. As we have commented numerous times, higher leverage available to buyers, specifically private equity buyers, applies upward pressure on acquisition prices. The complement is also true. In this article, we dive deeper on BDCs, their influence on the leveraged lending market, and the resulting impact on middle market business valuations.
A common discussion among our clients and partners is centered around business valuations: Will multiples keep going up? Are we approaching the end of the current economic cycle? While no one can predict the future, there are certain market indicators that can give us a glimpse into likely market conditions in the near term. One of these indicators is the value of BDC equity relative to their assets deployed or invested. Analysis of publicly-traded BDCs can give us a view into middle market acquisitions, a market that is otherwise opaque.
Business Development Companies
The concept of BDCs was created by Congress in 1980 as an amendment to the Investment Company Act of 1940. In summary, BDCs are publicly-traded companies that invest in and finance small to medium-sized businesses in the United States. BDCs can be viewed as a transparent portfolio of loans giving retail investors access to private investment opportunities, similar in nature to a publicly-traded private equity or venture capital firm.
BDCs are governed by certain operating and financial restrictions, including requirements to:
- Invest at least 70% of their assets in private U.S. companies or public U.S. companies with market values less than $250 million.
- Report to shareholders like traditional operating companies, including quarterly and annual reports filed with the SEC.
- Distribute at least 90% of taxable income to shareholders (if registered as a Regulated Investment Company (RIC) with the IRS).
- Maintain maximum leverage of 2:1 total debt to equity, with anything above 1:1 debt to equity requiring shareholder or board approval; phrased differently, BDCs must keep their ratio of total assets to total debt above 1.5:1.0.
- Mark loan portfolios to fair value on a regular basis.
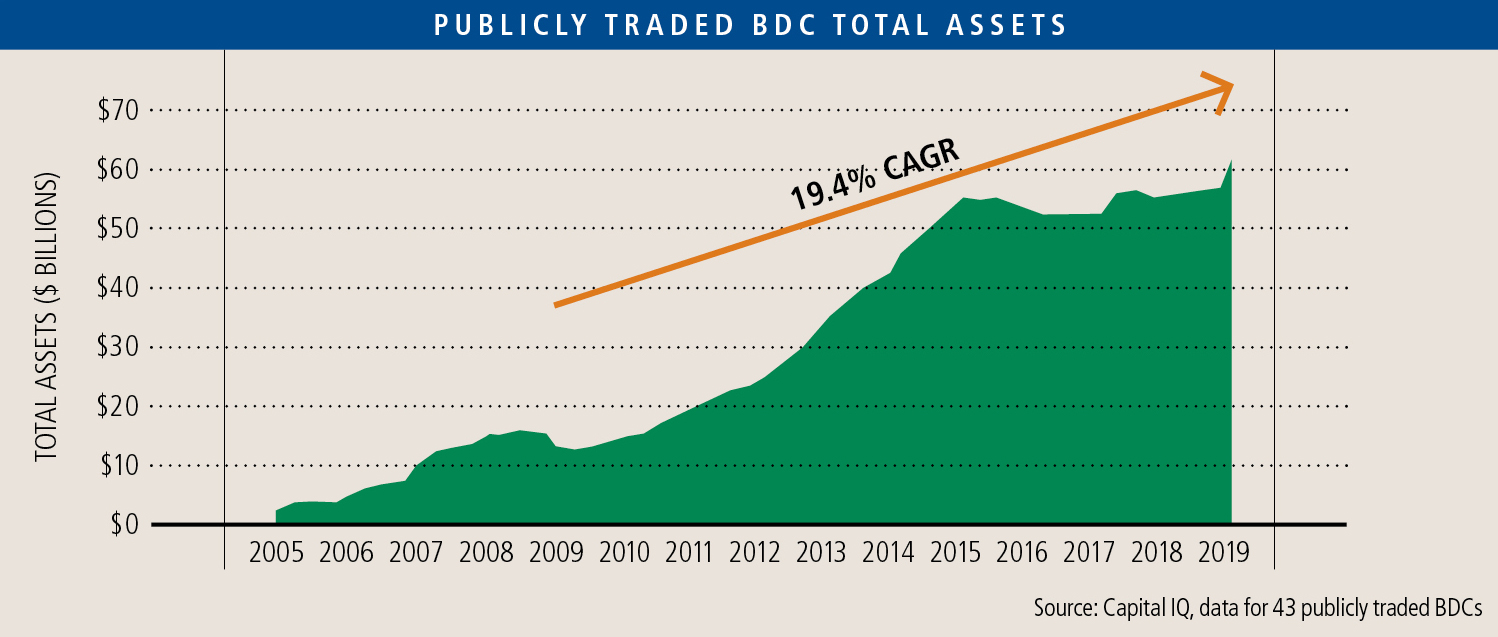
Since 2009, BDCs have exploded as major players in the leveraged lending market, with total BDC assets growing at a compound annual growth rate (CAGR) of more than 19% over that time period. The primary users of BDC financing are buyout private equity funds, who utilize financial leverage to support their transactions and boost equity returns.

A common BDC offering to a private company is a unitranche non-amortizing loan allowing only a small line of credit (usually from a commercial bank) to have a priority claim on assets and cash flow. Currently, this unitranche loan will be issued in an amount of between 4x and 6x EBITDA (depending on size of business) and will carry a price in the range of 8.5-9.0% p.a. Because of the non-amortization feature, a company can often support higher debt than with other debt structures. The growth in the market is an indicator of demand – primarily by buyout firms seeking to push the leverage level on their transactions as far as possible.
Private equity buyers are typically willing to pay more for a business when more leverage is available. As such, the rise in BDC assets since 2009 has corresponded with a strong rise in overall middle market private equity valuations. Although buyout multiples are a function of many factors, leverage is one and the absence of leverage dampens the prices private equity buyers will pay.
BDC Valuations

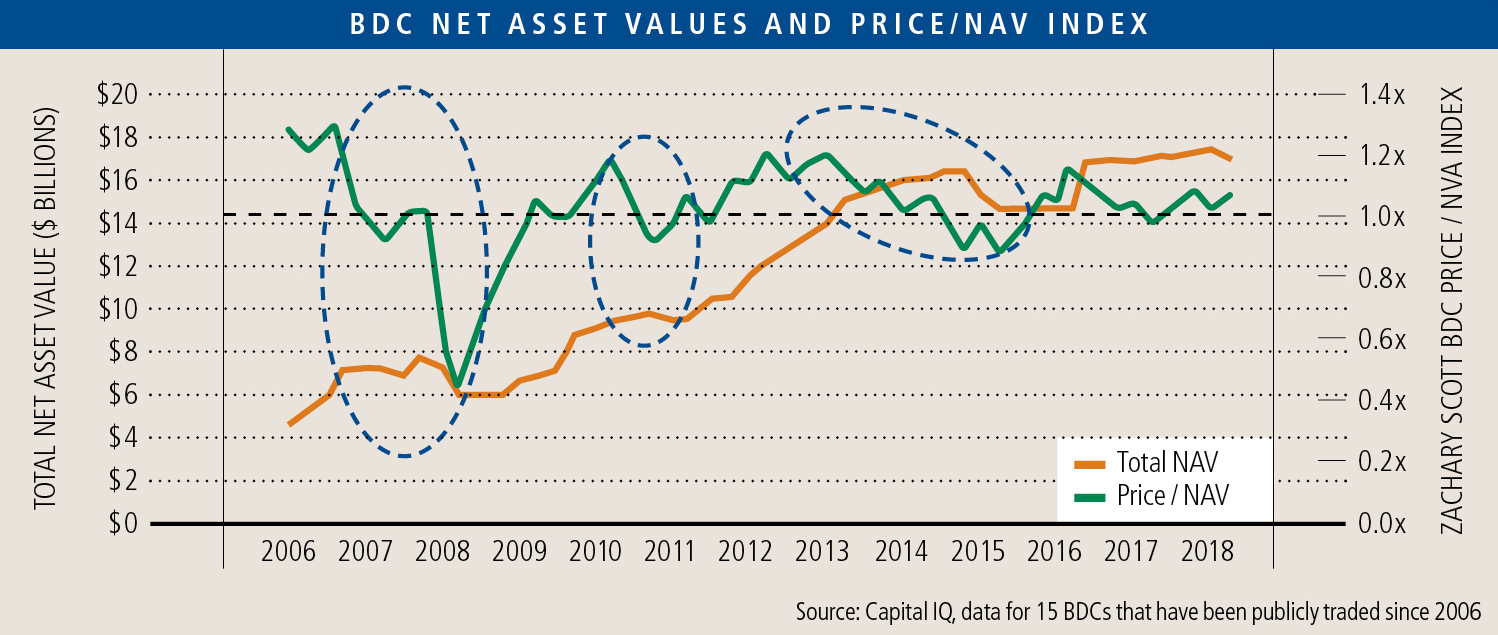
Since many BDCs are publicly traded and by regulation have to continually update their investors with their performance, when BDC portfolios have problems, the market reduces the value of the loans it holds. The common metrics used to assess the health of a BDC are its Price to Net Asset Value (NAV) per share and its Debt to Equity. When a BDC’s Price/NAV ratio dips below 1:1, it is an indicator that the market views its loans as not being worth what they have been booked at on the BDC balance sheet. When its Debt to Equity climbs above 2.0, it is restricted from borrowing more. Either metric is an indicator that the BDC is having troubles with its ability to continue its current lending practices.
Several times over the past 10+ years, the market has anticipated declines in NAV before those declines are apparent on the financial statements on the BDCs—in the graph above, this manifests itself as a decline in Price/NAV just before a decline in Total NAV. Such events occurred in the year leading up to the start of the “Great Recession,” and again in 2011 and 2013-2015. These were indications that investors had grown skeptical of the underlying credit quality of BDC portfolios, which then reflected in the trading price. Since 2011, the swings have not been as sharp, and BDCs have generally hovered around the 1:1 Price/NAV ratio we would expect in a stable or growing market. Today, in aggregate, public BDCs are borrowing at a rate of 0.8:1.0 Debt/Equity, leaving substantial room for additional borrowing and subsequent lending before reaching the 2:1 regulatory limit.
The market for private capital remains extremely competitive, with more and more capital chasing fewer and fewer opportunities. In our discussions with BDCs, they have indicated a pressing need to deploy available capital and an increasing willingness to take on additional risk. BDCs have been forced to become less selective on which opportunities they pursue, while also reducing pricing and relaxing covenant restrictions. Given the continued pressure to deploy capital, and the availability of additional capital through both debt and equity, we expect to see continued pricing pressure on this segment of the capital markets.
Conclusion
Business values have been high from an historical perspective for the last three years. As with any trend that cannot continue forever, we think it is important to understand the drivers of those valuations and, where possible, monitor those drivers for indications of what may lie ahead.
We have always maintained that one of the important drivers to business prices is the abundant availability of cheap credit to fund transactions. While not a sole predictor of things to come, BDC performance is an important indicator of where the market is headed as it relates to credit availability. Given the current perception of BDC portfolio health, availability of additional leverage within BDCs and their continued appetite to deploy capital, it appears that private equity investors will continue to be armed with substantial cheap capital, which will play its part in maintaining high valuations.
