


Readers of our work will recall that Zachary Scott is a strong proponent of determining the value of a business, project, or acquisition by discounting the future cash flows of that endeavor instead of using rules of thumb such as multiples (see “The EBITDA Multiple Impact On Businesses with Long-Lived Assets” from 2020, “Pitfalls of Business Valuations” from 2017, “Growth, Leverage and Multiples” from 2015, “What’s in a Multiple” from 2014, “Value—In the Eye of the Beholder” from 2006, “The Appeal of EBITDA Multiples” from 2002, among many others).
In part, our approach is dogmatic because it is definitional—textbook corporate finance defines value as the sum of the discounted future cash flows. This formula explicitly determines the implicit opportunity cost behind the heart of every business decision. In our scenario, You can either build a new warehouse for $10 million and earn an expected return of 10% or you can invest that $10 million somewhere else (e.g., the stock market) and earn an expected return of 10%.
The discounted cash flow approach to valuation makes it clear how much the company can afford to pay ($10 million) for a business opportunity (to build a warehouse) before it should stop and choose its next best option. The devil, of course, is in the discount rate. “What is my opportunity cost?” asks our warehouse-curious executive, ”How much return does it earn?” Fortunately for us investment bankers, executives, and owners, ivory tower academics discovered the law of CAPM (The Capital Asset Pricing Model) in the 1960s, saving business professionals around the world from existential dread resulting from needing to determine the opportunity cost of building banalities such as warehouses.
CAPM gives us a practical commandment to work with. With the advent of Microsoft Excel in 1985, discounted cash flow analyses of business decisions were suddenly calculable by anyone with a personal computer, and a revolution was afoot. We could suddenly start making quantitative (read “better”) business decisions. At its core, the law of CAPM is simple. Publicly traded equities will, on average, return:
Equity Return = Bond Return + Beta * Equity Risk Premium
Where beta is a rather mysterious “risk factor.” Outside of the concerns about our friend beta, so far so simple. Our warehouse-contemplating executive then says: “Great, with the cash on my balance sheet, I can either build this warehouse and take advantage of a proprietary opportunity available to my business or invest in publicly traded equities to earn a return (say, 12%) depending on my owner’s risk tolerance.” In other words, the return of publicly traded equities is the opportunity cost of making a private investment—it is the cost of equity. This is well and good but not entirely complete. In response to our savvy, opportunity cost-calculating executive, one of our good friends from the ivory tower says, “Actually, you can use $7.5 million of debt to pay for some of the initial investment in building the warehouse, so we need to account for that.” Lo and behold, in the late 1970s, the “weighted average cost of capital” (“WACC”) was born. It too turns out to be a law of finance, and is codified in the following formula:
WACC =
Proportion Debt Financing * Cost of Debt + Proportion Equity Financing * Cost of Equity
In other words, the opportunity cost for our executive’s option to build a warehouse is not just whatever return the owner could make in the market (the cost of equity) but something more complicated. In order to make a good investment, our executive needs to earn at least the interest rate on the construction loan—say 8% (this is our executive’s cost of debt)–on the first $7.5 million of capital and then the stock market return—the 12% target—on the final $2.5 million of required capital. The executive then calculates:

as the WACC, which is the quantitative opportunity cost of building the warehouse. Unfortunately, our (now slightly less beloved) academic steps in again and ponders: “But now we need to account for the fact that you are leveraging your equity using the debt to build part of the warehouse.” Our bewildered business executive replies: “What? My alternative is to just invest $2.5 million in the market. That’s how much money is coming off my balance sheet to pay for the warehouse.” “Not so,” counters the academic, “on average, publicly traded stocks are capitalized 50-50 debt to equity. You are contemplating an investment 75-25 debt to equity. There are more dollars of debt that must be paid off before you get an equity return when you build a warehouse. There are fewer dollars of debt that publicly traded companies have to pay off before you get a return on your stock market investment. Building a warehouse, from a financial perspective, is riskier than buying publicly traded stocks.”
Indeed, our academic friend is correct. Regardless of our executive’s confidence that building the warehouse will earn the owners money (and avoid default and bankruptcy), the reality is that projects, businesses, and opportunities with more leverage are statistically more likely to default. The equity invested in the warehouse is subject to a higher degree of risk than the same amount of equity invested in publicly traded stocks. Fortunately, the 1970s also produced the solution to this concern. Hamada’s equation says that the amount of risk—the beta from our equity return equation above—is proportional to the equity leverage. More precisely, the Hamada equation states:
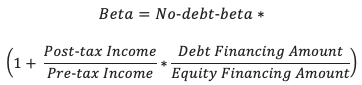
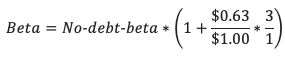
“Ok,” says our executive, “I somewhat understand. The amount of risk I take on when investing in a warehouse is at least some amount of ‘fundamental’ risk plus the debt-to-equity ratio of my project adjusted for the fact that I don’t pay taxes on interest payments, but I do on equity earnings. My owner is in the top marginal tax bracket and will pay 37% taxes on any income from this project—only 63% of the income is retained—and my debt-to-equity ratio is three to one.” To compute the appropriate, levered level of risk for the warehouse investment, the executive sets up the equation:
Still, not all the necessary components are yet known. “But how do I determine what the ‘fundamental’ risk is? Is it just the risk of investing in the stock market?” asks the executive. Our confident academic was already ready for this question. “Well, the law of CAPM says that if we hold a broad market portfolio and are contemplating a small, incremental investment to a single company or sector, we should expect to earn a return equal to how much additional market risk we assumed.” “Say that in plain words,” eyerolls our executive. “Since you run a food manufacturing company and are contemplating making an additional investment in the food manufacturing sector, the fundamental risk you are assuming is that of the food manufacturing sector,” states the slightly flustered academic. “Consulting a database like Damodaran’s Betas by Sector, the fundamental risk of building a warehouse for your business is 0.6 times as great as investing in the whole market.” The executive confirms: “So I need to earn at only 0.6 times the stock market return premium just for reinvesting in my own business because the food manufacturing sector is less cyclical, sorry— less risky, than the whole market?” “Yes, and then you need to get compensated for the financial risk—the leverage—you are taking on by using all that debt to help build the warehouse.” confirms our favorite academic. By this point, our food manufacturing executive is very close to calculating the opportunity cost of investing in the warehouse.
He uses the beta formula above to calculate the risk to his equity of:
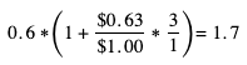
“That seems like a lot of risk,” says the executive. “Investing in this warehouse is 1.7 times as risky as investing in the broader publicly traded market?” The academic points out: “You are taking on a lot more debt than most publicly traded companies.” “But how can that even be an opportunity cost? Is it even possible to invest 1.7 times into the stock market with $2.5 million?” “Well,” responds the academic, “Just like you are planning to borrow money to build the warehouse, you can take out a margin loan to invest in the stock market. That is really what your alternative is to building the warehouse—building the warehouse is so risky that you would need to take out a margin loan to invest in the market to achieve the same level of risk.” “Wow!” exclaims the executive. “That makes me a bit more nervous about building this warehouse.” “That is what the beta formula indicates,” contemplates the academic before chirping back up— “But now you can use the equity return formula to calculate what the opportunity cost of your $2.5 million of balance sheet cash is.”
Our diligent executive goes to his favorite database to find his favorite bond and a different database to find the equity risk premium (We at Zachary Scott recommend using the current yield of the 10-Year Treasury as the minimum term, and Damodaran’s equity risk premium calculation for the month, respectively). He then computes:
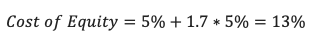
“See, that’s not far off what I thought the cost of equity was at 12%!” exclaims the executive. “That means the cost of capital—the discount rate—is somewhere between nine and ten percent. By building this warehouse, my cash flow return is 10%, which is slightly better than my cost of capital. We should build the warehouse after all!”
Unfortunately for our favorite business executive, this conclusion is incorrect. He executed the discount rate calculations properly and used all the right data sources, but he was misled. The executive badly misplaced confidence in the academic’s explanation of how to calculate the equity risk. While the executive thought the warehouse investment is pretty risky after calculating the beta, the building project turns out to be far riskier than he could contemplate. The academic misinterpreted how to apply CAPM to the executive’s company, which means our food executive is on the brink of making a terrible, terrible investment from a financial point of view. In our next article we will show exactly where it all went wrong.